
Cartography and Visualization
Resource Description
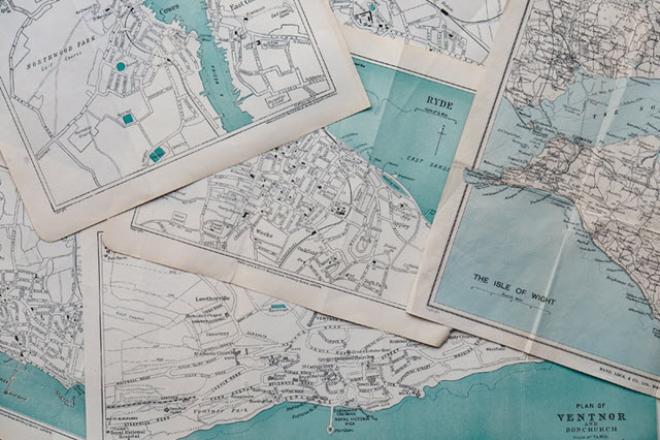
Maps are powerful visual tools, both for communicating ideas and for facilitating data exploration. In GEOG 486: Cartography and Visualization, you will learn design principles and techniques for creating maps with contemporary mapping tools, including ArcGIS Pro. In this lab-focused course, you’ll apply cartographic theory to practical problems, with a focus on design decisions such as selecting visual variables, classifying and generalizing data, applying principles of color and contrast, and choosing projections for maps. You will also be introduced to future-focused application topics such as augmented and virtual reality, mapping with multivariate glyphs, the visual depiction of uncertainty, interactive geovisualizations and (geo)visual analytics, and decision-making with maps and mapping products. Successful completion of this course will signify mastery in map production for communication and research; you will be practiced in making, analyzing, critiquing, and sharing high-quality maps. Learn moreComputation and Visualization in the Earth Sciences
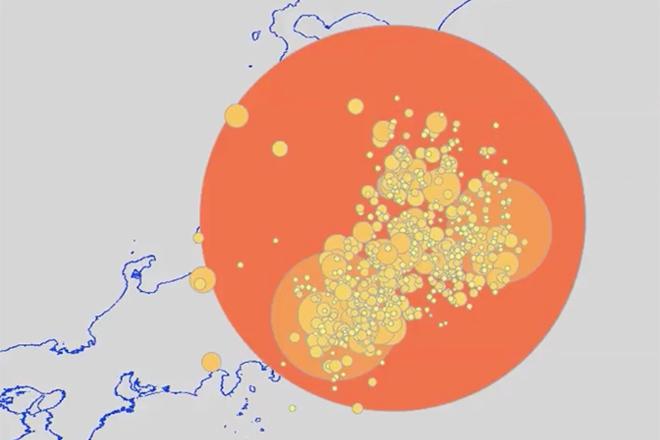
Credit: Earthquake locations from USGS by E Richardson © Penn State University licensed under CC BY-NC-SA 4.0
Resource Description
In EARTH 801, you will develop skills in a programming language designed for visual arts and visualization while exploring Earth science topics. Specifically, you'll learn and practice digital graphics capabilities in order to render Earth science concepts that are otherwise difficult to visualize due to complicated space and time scales. Here, you will interact with large, open, freely-available data sets by collecting, plotting, and analyzing them using a variety of computational methods. You'll be ready to teach secondary school students a range of Next Generation Science Standard skills involving data collecting, manipulation, analysis, and plotting. You'll also read and discuss current research regarding the teaching, learning, and evaluation of visualization skills, as well as multiple external representations of science concepts. Learn moreWeb Application Development for the Geospatial Professional

Credit: Ipad, Map, Tablet, Internet, Screen by FirmBee is licensed under CC0